A report labeled “returns” can lead an AI assistant toward the wrong conclusion if its rows also include cancellations, refunds without returned products, or other order adjustments. Before asking for reasons customers send products back, define which events are actually in the input.
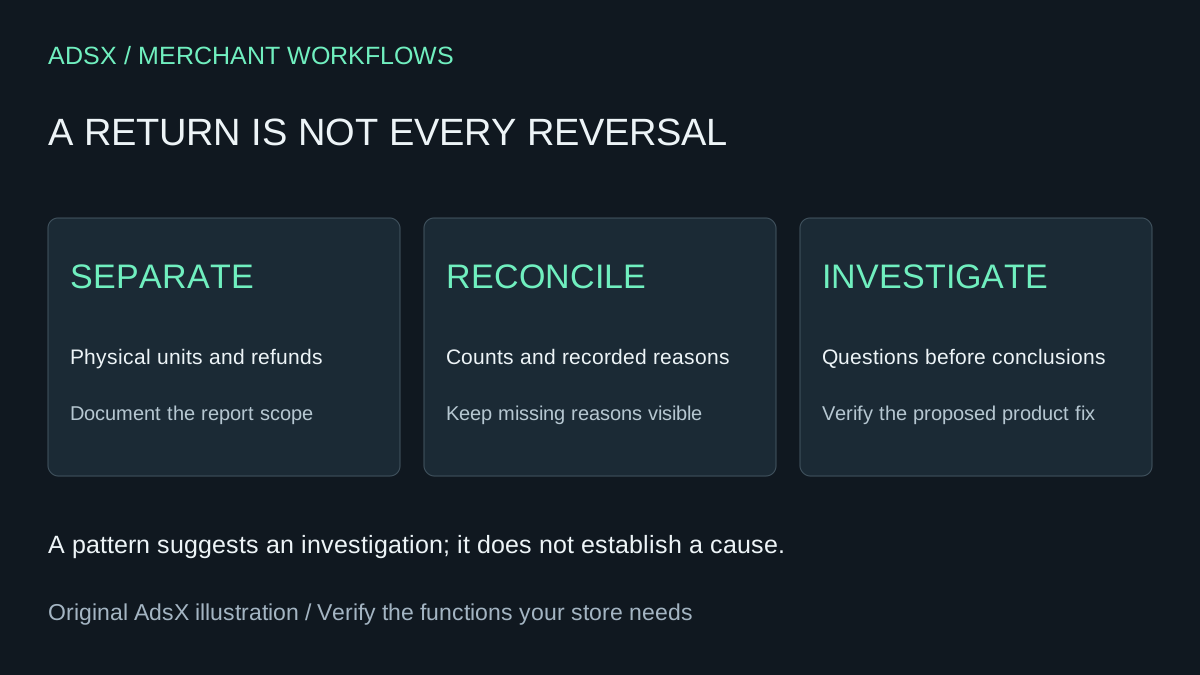
Original AdsX illustration.
This guide builds a small review process for physical return reasons. It does not automate refunds, reject customer requests or claim an AI model has discovered the cause of a product problem. All numbers and prompts below are original illustrative examples, not results from an AdsX merchant test.
Separate the three questions
A product team might ask why units came back. A finance team might ask how much money was refunded. A trading team might ask how much sales value was reversed. Answering one of those questions does not answer the other two.
Shopify's sales-report reference distinguishes physical returned quantity from reversed quantity, which includes other line-item removals. It also documents a return line-item reason. For physical returns, the guide points to returned_quantity from the Returns table. Verify the fields and report available in your own admin before exporting; do not assume an old saved report still uses the same terminology.
The sales discrepancy guide separately explains that returns and refunds appear in different reporting contexts. Date selection and report logic can also affect comparisons. Reconcile the source rather than asking an assistant to explain away a mismatch.
Build a small, documented input table
Start with the product or variant identifier, physical returned units, selected return reason, reporting interval and any source notes needed to interpret the row. Add free-text notes only when necessary and authorized. Remove names, emails, addresses and payment details; product analysis usually does not need them.
Keep the original extract unchanged. Work from a copy and preserve a row identifier so a reviewer can trace a classification back to its evidence. If the source has no reason, label it missing. “Unknown” is a legitimate category, not a problem for AI to solve by guessing.
| Fictional SKU | Physical returned units | Selected reason | Review question |
|---|---|---|---|
| GLOVE-S | 8 | Too small | Does the size guide explain the measurement? |
| GLOVE-M | 3 | Too small | Is this the same issue or a different fit expectation? |
| POT-12 | 2 | Damaged | Does packaging or handling need investigation? |
| POT-12 | 1 | Missing reason | Can an authorized source clarify it? |
These rows total 14 returned units. The example is deliberately small enough to recalculate. It does not establish a return rate: that requires an appropriate denominator and a clear rule for matching the sales and return populations.
Ask AI for hypotheses with evidence
Use this prompt with a sanitized table in an approved analysis tool:
Analyze this table of physical return units and recorded reasons.
Keep source reason values unchanged and preserve each row ID.
Calculate totals by SKU and recorded reason; show your arithmetic.
Separate missing reasons from known reasons. Do not infer customer intent.
Propose at most three operational questions, each linked to source rows.
For each question, state what additional evidence would confirm or reject it.
Do not call a pattern a cause, calculate a rate without a valid denominator,
or recommend changing refund eligibility or customer records.
An answer that says “the gloves have a sizing defect” exceeds the table. A better answer asks whether measurement instructions, product tolerances, audience expectations or variant selection explain the recorded fit complaints. Those are competing hypotheses to investigate.
Manually check the arithmetic or use spreadsheet formulas. A fluent summary can double-count a multi-unit row or treat every row as one unit. Ask for counts and units separately when both matter. Do not add together overlapping categories and call them unique returned products.
Choose one change and a fair comparison
Suppose the team finds that the glove page lacks a measurement diagram. An appropriate next step might be to add a verified diagram and clarify the fit explanation, then watch a comparable cohort. It would be premature to claim the page change reduced returns immediately after publication.
Return timing matters. A recent sales cohort has had less opportunity to send items back than an older cohort. Promotions, seasonality and product changes can also alter who buys. Write down the comparison period, product scope, exposure to the new content and the return window before interpreting a movement.
Keep a decision log with the source interval, issue, proposed action, owner and review date. If investigation finds no useful change, retain that result. An analysis process that occasionally says “not enough evidence” is more useful than one that produces three confident recommendations every week.
Decide whether the workflow replaces an app function
A manual export and AI-assisted summary may cover a small recurring diagnosis task. It does not provide a return portal, label generation, routing, exchanges, policy enforcement or warehouse processing. Keep those functions separate when comparing returns and exchange apps.
For a hypothetical monthly review, an analyst might budget one hour at $30 plus any incremental tool cost. If a specialist report already answers the question reliably in ten minutes, rebuilding it may cost more despite having no extra subscription. Use the full-cost worksheet and record real effort before claiming savings.
Save the brief in the merchant prompt library. The useful output is a traceable question and a decision about what to investigate next, not a dramatic narrative about why customers return products.