Your average basket shrinks even though online and retail customers spend the same amount as last month. Cutting prices would address the wrong problem. A larger share of orders may simply be coming from the lower-value channel.
Original AdsX illustration.
Start with the same population of orders
Shopify sales reports can break sales down by channel. Choose two complete, equal-length periods and record the currency, filters and metric definitions. Sales channel describes where the order was placed; it is a different question from which marketing source deserves credit. Keep those dimensions separate while diagnosing the change. Shopify sales reports
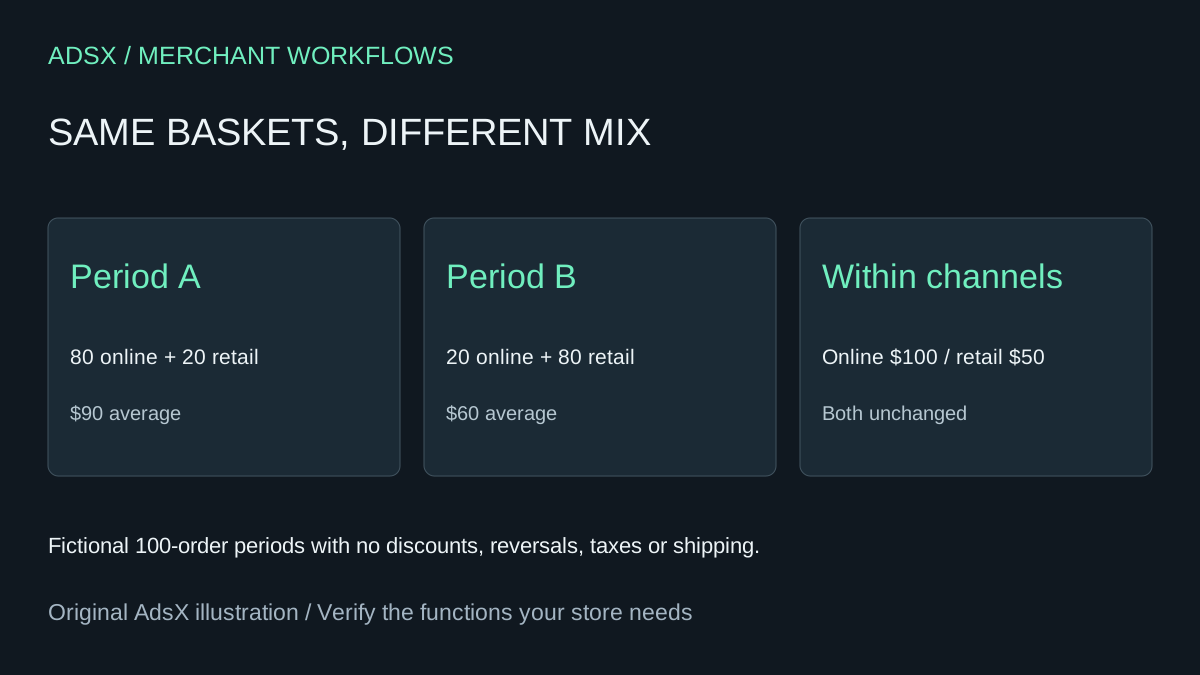
Here is a fictional example with no adjustments. Period A has 80 online orders at $100 each and 20 retail orders at $50: $9,000 across 100 orders, or $90 per order. Period B has 20 online orders at $100 and 80 retail orders at $50: $6,000 across 100 orders, or $60 per order. The blended average falls by one third. Neither channel's average changes.
For a simple diagnostic, apply period B's channel averages to period A's order counts. The result remains $9,000. Under those fixed weights, the entire difference in this example comes from the changed mix. In a real store, both the weights and within-channel averages can move; state which period supplies the weights rather than presenting one decomposition as the only possible answer.
Ask AI for a checkable table
Export period, channel, order count and a consistently defined sales amount. Ask an assistant to calculate each channel's share of orders and its average, then reproduce the combined totals. Do not average the channel averages without weighting them. If you use Shopify's average order value metric, retain its documented treatment of adjustments rather than silently substituting net sales per order.
Shopify lets you select metrics, dimensions and comparison periods in reports. To investigate the merchandise next, group sales by channel and product. A nested table can reveal whether a product is falling in both channels or only in the channel that lost volume. Shopify report configuration
Choose the action after locating the change
If both channels are stable but the mix moved, investigate why the order source changed: a retail event ending, an online stockout or a campaign shift are hypotheses to check against records. If one product falls within both channels, inspect its availability and pricing. The worksheet locates the difference; it cannot establish why customers behaved differently.
This is a native-report export plus an external analysis prompt. It does not require building a Shopify app or granting an assistant write access.
Try the worksheet prompt
Illustrative prompt, not execution-tested.
Using period, sales channel, order count and consistently defined sales amount, calculate channel order shares, channel averages and weighted overall averages. Reconcile totals. Reweight current averages using prior order counts and label that assumption. Flag changed filters, mixed currencies, missing channels and metric-definition differences. Do not claim causation or change prices.
Copy the prompt from the merchant library. For related work, see Find a Renamed Shopify Product in Historical Sales Reports.