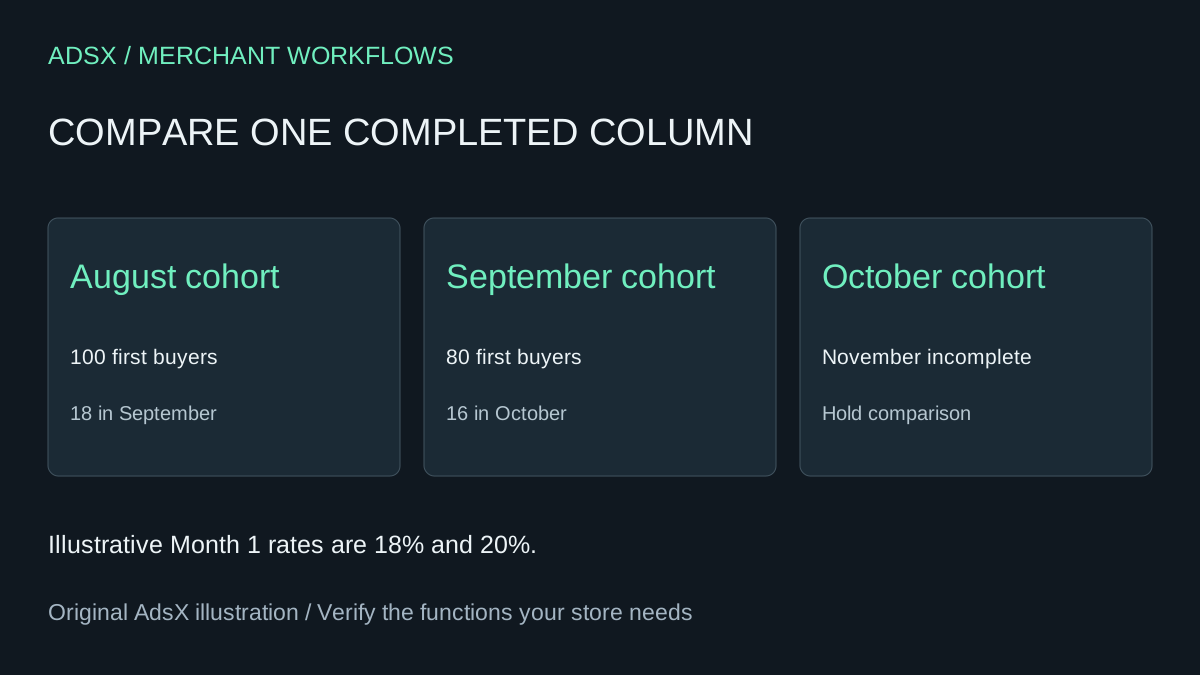
October customers appear to be coming back half as often as September customers. If today is November 10, October’s buyers still have most of their next calendar month ahead of them. Start with the observation window before changing a replenishment offer.
Original AdsX illustration.
Read the row label and column together
Shopify’s default customer cohort analysis groups customers by when they first ordered. In the monthly view a second purchase in that same month can count in Month 0. Month 1 refers to the next calendar month. A buyer acquired on September 30 who returns October 1 and a buyer acquired September 1 who returns October 31 can both contribute to September’s Month 1. For a precise question about returning within 30 days, use dated purchase intervals. Shopify customer cohort report
Record your selected metric and cohort definition. For this worksheet use distinct returning buyers in the column divided by the original cohort size. One buyer who places three repeat orders contributes one buyer. Buyers who appear in different month columns can overlap, so adding those columns will overcount unique people.
Use the numerator before interpreting the percentage
In the example, August has 18 returning buyers from 100 and September has 16 from 80. The repeat rate improves by two percentage points while the number of returning buyers falls by two. Across both cohorts the comparable rate is 34 divided by 180, about 18.9%. Averaging the two percentages gives disproportionate weight to the smaller row.
Give an assistant the cohort month, first-buyer count, observed repeat-buyer count, reporting cutoff and filters. Have it mark incomplete cells before doing any division. A blank future cell means the interval is unobserved. A completed cell with zero repeat buyers is a valid zero. Review subscription mix and acquisition source before attributing a change to a campaign. If a segment is small, report the counts alongside the rate. Shopify analytics field reference
Try the worksheet prompt
Illustrative prompt, not execution-tested.
Compare these fictional monthly first-purchase cohorts at Month 1. Use the cutoff to flag incomplete calendar months. Calculate rates from unique repeat buyers and original cohort sizes, show percentage-point changes and a weighted combined rate. Flag missing or inconsistent counts.
Copy the prompt from the merchant library. For related work, see Why Is My AOV Falling on Shopify? Fixes Inside.